Pharmaceutical Pipeline Profiling
Introduction
Structure Types
Molecular Formulae, Size and Compactness
Therapeutic Areas
Pharmaceutical Companies
Pipeline Success Rates
Conclusions
Introduction
The profiling of the relationships between the chemical structures of pharmaceutical agents and their
therapeutic areas and clinical pipeline progression can give useful insight for decision-making concerning
drug design and development. For this purpose, a proprietary database has been built over the past five
years with over 10,000 entries covering pharmaceutical entities in the clinical pipeline or launched in the
last ten years. It includes information from the pipelines of over 1000 pharmaceutical companies.
The discussion below gives some of the findings, but the offering of McCague Scientific Consulting extends to
bespoke detailed analysis for more specific needs. For instance if you are a pharmaceutical company
developing a particular structural class of compounds, the analysis could help to identify other
biological activities that the structural type might possess. Alternatively the analysis could help to select
new directions to take structural modification in analogue development, through analogy with other drug-classes.
It could be used to identify hybrid structures that possess activity against more than one target, or to introduce
structural features that give rise to better selectivity. For chemical companies, the offering can help to
identify target pharmaceutical actives and intermediates that the companies' technology could advantageously
access.
Structure Types
Here is given an analysis of the incidence of particular structural features in approved and investigational new molecular entity drugs. They may be broadly divided into small and large molecules. The small molecules may be classified according to their chirality properties, whilst the large-molecule pharmaceuticals encompass biologics, peptides, vaccines, oligonucleotides and oligosaccharides. For this analysis the pharmaceutical entities are divided into the following structural classes:
- achiral compounds
- chiral synthetic compounds
- racemates
- chiral natural-products and derivatives
- peptides and biologics
The vaccines and oligonucleotides have been included with the biologics while oligosaccharides are included with the natural
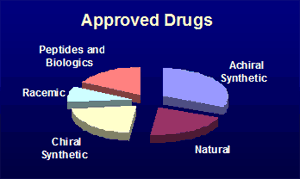
products respectively. The analysis has been done for a list of 572 drugs approved since 1996 (mainly by the FDA:
www.fda.gov), 995 entities in the World Health Organisation lists
(numbered 41-57: www.who.int) of
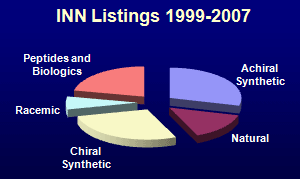
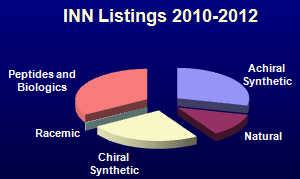
International Non-Proprietary Names (INN) from 1999-2007, and 427 entities in the more recent lists (numbered 62-66)
from 2010-2012. The distributions for these three sets of compounds are shown
by the pie-charts below.
Compared to the launched drugs, the INN listings represent on average
more recent profiles of drug-development preferences, so trends can be seen. In particular,
the proportion of large molecule compounds (peptides and biologics) is increasing. Indeed, looking for new entities entering
clinical trials, the split between large and small molecule drugs is now about 50:50. Development of racemic drugs has
become rare, whilst curiously, the proportion of compounds of natural product origin is decreasing.
Molecular Formulae, Size and Compactness
The main division for molecular size of a pharmaceutical entity is whether it is a large or small molecule. Of the largest are antibodies which have around 6500 carbon atoms/molecule and molecular weights around 150,000. However, this discussion will concern the structures of small molecules that can be made or modified by chemical synthesis. The Table below gives molecular formulae with the median numbers of each atom together with the median molecular weights, for the small molecules in the same lists of compounds as above.
| Approved Drugs | From INN Listings | |||
|---|---|---|---|---|
| Formula | Mol.Wt. | Formula | Mol.Wt. | |
| Achiral Synthetic | C17H19N3O3 | 318 | C20H21N3O2 | 378 |
| Chiral Synthetic | C20H25N2O4 | 389 | C22H25N2O4 | 410 |
| Racemic Synthetic | C19H22N3O3 | 367 | C19H23N2O3 | 362 |
| Natural Product | C24½H30N2½O6 | 462 | C25½H32N3O6 | 494 |
Some interesting observations may be made from this Table. Molecular weights increase in the order:
Achiral < Chiral < Natural, so in this regard the chiral synthetic molecules may be viewed as structurally
intermediate between the Achiral and Natural ones. Indeed, certain chiral molecules, e.g containing unnatural
amino acids, are modelled on natural products. The proportion of oxygen in the molecules also follow the same
sequence. Comparing the approved drugs (older) with those in the INN listings (newer), the molecular weights are
higher with those in the INN listings. This can be attributed to advances in technology making syntheses or
handling of the higher molecular weight molecules more accessible. Curiously, an exception is with racemic
compounds, where the molecular weight has not increased with time, and in the INN list have a median molecular weight
less than for even the achiral compounds.
The median molecular formulae in The Table above only include C,H,N,O because the median values for all other
elements works out at zero. Accounting for other common elements the Table below calculates the mean values for
various non-metallic elements after discarding the highest and lowest 10% which may contain anomalous structural
types. Note that the mean fluorine content (0.56 atoms/molecule for the achiral moleucles) does not round to 1
for the median because when fluorine is present, it is often in groups, especially as -CF3. The fluorine
content from structures in the INN listings is greater than that in the corresponding achiral approved drugs
(0.32 atoms/molecule) showing that use of flurorine as an element in synthetic drugs has been increasing. On the
other hand, the usage of sulfur has stayed the same at 0.35 atoms/molecule.
| INN Listings: Average Molecular Formulae | |||||||||
|---|---|---|---|---|---|---|---|---|---|
| C | H | Br | Cl | F | N | O | P | S | |
| Achiral Synthetic | 19.8 | 21.5 | 0.02 | 0.28 | 0.56 | 3.21 | 2.80 | 0.02 | 0.35 |
| Chiral Synthetic | 21.0 | 24.9 | 0.04 | 0.18 | 0.74 | 2.47 | 3.19 | 0.01 | 0.25 |
| Racemic Synthetic | 19.1 | 22.2 | 0.00 | 0.09 | 0.33 | 1.98 | 2.95 | 0.00 | 0.31 |
| Natural Product | 26.7 | 36.4 | 0.02 | 0.15 | 0.15 | 2.65 | 6.71 | 0.11 | 0.34 |
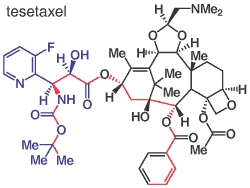
An interesting measure is that of molecular compactness. A related measure of non-rotatable-bonds was used by M.C. Wenlock et al (J. Med. Chem., 2003, 46, 1250-1256) to to reason that less flexible molecules should benefit from being metabolically cleared by the body more slowly. Here, the measure is by identifying the shortest chain between the pair of non-hydrogen atoms in the molecule that are topologically the furthest apart. So illustrating with tesetaxel (formerly under development by Daiichi Sankyo) as an example, the relevant path is shown in red in the Figure spanning 19 atoms. With 63 non-hydrogen atom in the molecule that gives a compactness of 63/19 = 3.32. The Table below gives values for compactness for the different categories of chirality amongst the compounds in the INN listings. Also given are the mean molecular weights, the chain length as mentioned above, and the numbers of aromatic (Ar) and non-aromatic (Cy, e.g. cycloalkyl) rings given that rings should provide molecular compactness. Note in the above categorisation of chirality, tesetaxel may be ranked as a chiral synthetic compound because the left hand chain (in blue) is synthetic even though the larger part of the molecule is of natural origin; because of this the Table above and below only include as chiral synthetic molecules, those where the chirality is entrirely of synthetic origin. With regard to the rings, it is as expected to find that aromatic rings are more predominant in the achiral compounds while cycloalkyl rings are most common in natural products, whilst as with the elemental formulae the properties of the synthetic chiral compounds lie in-between. However, it should be realised that rings are not necessary for molecular compactness. In particular, several peptide drugs have high compactness values, so for instance Ferring's decapeptide degarelix has a compactness value of 3.42 (though this still contains 8 rings). Indeed it is easily calculated that while polyglycine has a compactness of just 1.33, polylysine has a compactness of 3.00 despite no rings. This variation of compactness is an interesting property of peptides.
| INN Listings: Average Molecular Properties | |||||
|---|---|---|---|---|---|
| Mol.Wt. | Length | Compactness | Ar Rings | Cy Rings | |
| Achiral Synthetic | 384 | 14.8 | 1.87 | 2.66 | 0.50 |
| Chiral Synthetic | 420 | 15.3 | 1.96 | 2.17 | 1.20 |
| Racemic Synthetic | 348 | 13.9 | 1.82 | 2.00 | 1.00 |
| Natural Product | 526 | 17.0 | 2.18 | 1.40 | 2.66 |
Therapeutic Areas
From a list of investigational drug candidates (see next section) the therapeutic areas can be analysed. These divide out into percentages as follows:
- cardiovascular: 18%
- neurologic: 19%
- cancer: 25%
- inflammation: 14%
- infection: 14%
- metabolic: 10%
Most of the areas are self-explanatory but included in the cardiovascular section here are such ailments as diabetes and obesity because of the cardiovascular consequences. The metabolic section includes various hormonal and bone disorders. Within these divisions there are many therapeutic end points but detailing out some of those attracting particular attention and reflecting today's lifestyles we have (as percentages of the whole):
- diabetes (mostly type 2): 4.2%
- anxiety/depression: 3.6%
- asthma/COPD: 3.4%
- Alzheimer's/Parkinson's: 3.1%
- hepatitis: 2.8%
- HIV/AIDS: 2.6%
- rheumatoid arthritis: 2.5%
- schizophrenia/psychosis: 2.2%
- hypertension: 1.8%
- osteoporosis: 1.5%
Together, these specific areas make up 28% of the whole
The Table below gives the distribution of the six therapeutic divisions within various clinical phases of pipeline drugs, and of recent launches. It is seen that oncology represents 37% of all Phase 1, and 30% of Phase 2 drugs, but only 13% of those drugs launched in the last ten years. Perhaps the high proportion of early phase oncology candidates today means many new cancer drugs tomorrow, but it might reflect a lower proportion of oncology canditates being successful. See the section below on Pipeline Success Rates in this regard.
| Distribution by Therapeutic Area | |||||
|---|---|---|---|---|---|
| Phase 1 | Phase 2 | Phase 3 /NDA | Recent Launches | ||
| Total candidates | 925 | 1038 | 482 | 493 | |
| Cardiovascular | 13% | 21% | 18% | 20% | |
| Neurology | 16% | 23% | 18% | 16% | |
| Cancer | 37% | 30% | 21% | 13% | |
| Inflammation | 13% | 16% | 15% | 15% | |
| Infection | 12% | 13% | 12% | 23% | |
| Metabolic | 9% | 11% | 15% | 14% | |
More about therapeutic areas is given in the next section
Pharmaceutical Companies
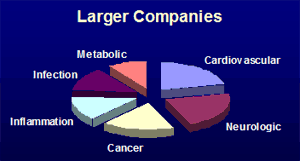
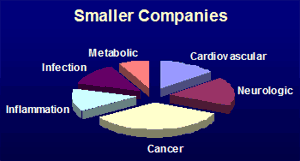
Surveys of pharmaceutical company pipelines trials ongoing from November 2006 to May 2009 according to www.clinicaltrials.gov identified 914 companies with new chemical entities in clinical trials. These companies report 2445 clinical phase entities. That averages 2.7 investigational drugs per company. However the distribution is far from even. Many small companies have only one clinical phase investigational compound. At the other end of the scale six top pharmaceutical companies (GlaxoSmithKline, Pfizer, Sanofi-Aventis, Merck, AstraZeneca, and Roche) report over 40 clinical investigational compounds each. A couple of interesting observations may be made by comparing the compounds from a group of the 44 larger companies (which have at least 8 clinical phase entities) with those of the smaller companies. Firstly, with respect to the therapeutic areas as shown by the pie charts below, there is more comparatively more emphasis on the cardiovascular area in the larger companies and more emphasis on cancer therapeutics in the smaller companies.
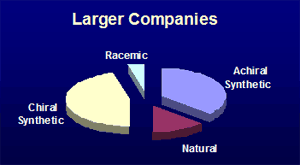
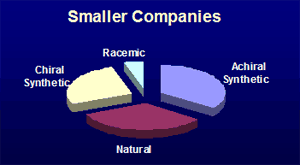
Secondly, there is a difference in the chirality distribution amongst the small molecule new molecular entities whose structures have been revealed. The larger companies have a higher proportion of chiral synthetic compounds, while the smaller companies have a greater emphasis on compounds where the chirality present is from a natural source. This may reflect the different resources of technology and contacts of the different sizes of company. This analysis matches with the suggestion of D.J. Newman et al (J. Natl. Prod., 2003, 66, 1022-37) that many pharmaceutical companies have de-emphasised natural product research, even though natural-products feature highly amongst existing approved drugs. Identifying such differences might help service provider companies to focus their sales and marketing effect towards the type of company that could have the most use of their offering.
Pipeline Success Rates
Overall success (or conversely attrition) rates of clinical phase pharmaceutical candidates can be estimated by analysing the events when a candidate moves to the next phase or ceases development. Such events, collected over an approximately eighteen-month period are counted according to the Table below. As well as estimating progression rates for the individual phases, a cumulative calculation suggests that the chances of an average drug entering Phase 1 clinical trial eventually being launched is only about 7%. The long time scale of clinical development means that the criteria for success may change, so the cumulative figure worked out this way is not necessarily representative of the future. In any case, the rather low measured success rate even at Phase 3 (46%) by this analysis is quite alarming.
| Number of Events | ||||
|---|---|---|---|---|
| Phase 1 | Phase 2 | Phase 3 | NDA Filed | |
| Progressed from: | 328 | 161 | 79 | 37 |
| Ceased from: | 281 | 327 | 93 | 8 |
| Total Events: | 609 | 488 | 172 | 45 |
| Success Rate | 54% | 33% | 46% | 82% |
| Cumulative Success | 54% | 18% | 8% | 7% |
More insight can be gained by carrying out such analysis on selected categories of pipeline drugs. For example, in the cancer area, the overall pipeline success rate works out at similar at 7%. However, a high 58% of candidates in oncology progress from Phase 1 to Phase 2, but only 33% are passing from Phase 3 to NDA submitted. This implies comparatively more candidates occupying Phase 2 and 3 and explains why cancer drug development is delivering a disappointing number of launched drugs in relation to its total number of pipeline candidates. By contrast, in the anti-infectives area, where the overall clinical success rate is 9.5%, there is high attrition at Phase 1 (51% progress on) but 55% entering Phase 3 are passing from Phase 3 to NDA submitted. The high late-phase attrition in oncology is presumably because in cancer treatment it takes a long time to demonstrate superior effectiveness over existing therapies, but it may also be that cancer research is more focussed in small companies (see above) who may be more reluctant than larger companies to drop candidates at an early clinical stage. Indeed the analysis reveals that while the larger companies drop 51% of their candidates from Phase 1, the small companies drop only 37% at this stage. Then at Phase 3, the chance of a small company progressing their compound further without large company involvement is only 27%.
Conclusions
The discussion above shows just some of the analysis that is possible in order to characterise the profiles of new pharmaceutical entities, and that could easily be customised for a more specific narrow section of the market if needed. As undertaken, it essentially covers a few snapshots of pipeline profiles and some cursory indication of pipeline-phase success, but can be developed to indicate more which pharmaceutical profile elements correlate with a better success rate towards becoming an approved drug. The other purpose of the profiling is to help identify structural features that may fit with a particular technology, in order to identify new business opportunities.