Theory of Solid-Solution Extent in Crystallisation Resolutions
Introduction
A Simple Diastereoisomer Solid Solution
A Pair of Diastereoisomers Forming a Eutectic
Binary Phase Diagrams
Conclusions
Introduction
Crystallisation methods are highly important industrially for the manufacture of single isomers. Yet, solid-solution formation is a frequent occurrence when trying to crystallise apart compounds of similar molecular structure. In particular, it is prevalent in the classical resolution technique of enantiomers (chiral isomers) using diastereoisomeric salt formation with a chiral resolving agent, although it can also apply to other separations, e.g. of geometric isomers of an olefin, or of a process-related impurity from a pharmaceutical intermediate. Here the crystal structure of the desired form accommodates molecules of the unwanted component to some extent . This is represented by the diagram below. The drawing on the left represents a crystal structure of molecule 'A' but that is infiltrated by molecules of an impurity 'B'. This may be what is seen when crystallising an enantiomerically enriched mixture of chiral isomers; so 'A' is the prevalent enantiomer and 'B' is its mirror image. The right hand drawing in the diagram below is when there is an additional component in the crystal structure represented by the grey circles. This could be the situation in classical resolution with formation of a diastereoisomeric salt from a pair of enantiomers ('A' and 'B') and a resolving agent (the grey circles). The closer structurally the wanted and unwanted compounds are, the more likely they are to form a solid-solution.
Solid-solution formation is a reason why in classical resolutions, the salt formed initially is rarely
diastereoisomerically pure. Furthermore, a consequence is that after an initial enrichment,
recrystallisation fails to give the desired level of purification, as the unwanted component continues to be
retained by the crystals. Several recrystallisations may be needed and then a poor yield is likely to obtained.
In order to understand solid-solution formation, it valuable to have a numerical measure of its extent.
This could be useful for example in a screen to select the best resolving agent, or to identify the preferred
conditions for scale-up. The following discussion introduces such a coefficient (termed 'D'), how
it is measured, and how it may be used to simulate phase diagrams and assist to identify preferred conditions
for scale-up. This theory has been published in more detail in an article entitled 'a measure of the
solid-solution extent useful for crystallisation resolution', McCague, R., Tetrahedron Letters,
2007, 48, 869-872
doi:10.1016/j.tetlet.2006.11.131.
The basis of the theory is to consider the equilibrium between the crystal phase and the liquor phase of a
crystallisation according to the Figure below. So molecule 'A' will equilibrate between the crystal phase
and the liquor phase according to a partition coefficient, p(A). Likewise molecule 'B' will equilibrate
between the crystal and the liquor phase according to another partition coefficient p(B). The ratio
of p(A) to p(B) then gives a measure of the solid-solution extent 'D'. which is short
for Distribution. The value of 'D' will range from zero if there is no solid-solution (all of 'B'
will be in the liquor phase) to one (or 100%) if the solid-solution is so extensive that the crystal phase cannot
distinguish between molecules 'A' and 'B' whatsoever. Then the ratio of 'A' to 'B' in the liquor and crystal
phases will be the same at equilibrium. At an intermediate value of D, e.g. 20%, the proportion of
molecules of impurity 'B' in the crystals will be somewhat less than its proportion in the liquors; such as
approximately shown by the Figure.
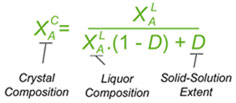
If separating two components, 'A' (desired)and 'B' (unwanted), the equation below has been derived to relate the crystal composition deposited (as the mole fraction of component 'A' in the crystals) with that of the liquors from which they are deposited, and the solid-solution extent coefficient D. As shown, this will give the composition of the crystals (at equilibrium) from the composition of the liquors if you know the value of D. This would be useful for instance if wanting to predict the effect of crystallising from a different liquor composition (e.g. when recrystallising to a higher purity). The equation can easily be rearranged to give the value of D from the liquor and crystal compositions. That is useful in comparing different crystallisation experiments to see which gives the best resolution or purification performance - i.e. the one giving the lowest D value. That would be used for instance in conducting a screen for a resolving agent to separate chiral isomers. Generally it will be desired to have D < 5% for a good resolution. The equation can also be modified other ways, for instance to be in relation to the mole fractions of impurity rather the of the main component (since the mole fractions of 'A' and 'B' add up to 1), or to be in relation to the enantiomeric or diastereoisomeric excesses of the crystal and liquors if separating enantiomers or diastereoisomers respectively.
A Simple Diastereoisomer Solid-Solution Phase Diagram
The above equation can be useful for the simulation of phase diagrams. A calculated phase diagram is shown below for resolution in a solvent at a fixed temperature of a solid-solution having a value D = 20% . Each point on the diagram represents a particular composition of the components 'A', 'B' and Solvent. The thick sloping line on the diagram represents compositions of a saturated solution, i.e. the solubility of the 'A'/'B' composition; so here 'A' is the less soluble and 'B' the more soluble. It happens that the ratio of the solubilities of 'A' to 'B' (according to this approximated simulation) will be equal to D. If D = 100% (a complete solid solution), the solubility line will be horizontal, while if D = 0, it will lie parallel to the Solvent-'B' axis. The clear area above the solubility line (also known as the liquidus) on the diagram represents a clear solution. Below the solubility line, a given composition will, at equilibrium, split into a saturated solution and some crystals. Their respective compositions are given by a series of tie-lines. It will be seen that a higher proportion of desired component 'A' to start with will give a better crystal composition, but no matter what is the starting composition, if there is some unwanted component 'B' present, the tie line will not quite reach the lower-left apex of the diagram representing pure desired component 'A' due to the effect of the solid-solution. The phase diagram also shows that starting with a more dilute solution (higher on the chart) gives a better crystal composition (in respect of the mole fraction of 'A'), but then the yield of crystals will be lower.
To give a feel for the impact of particular value of D when performing a resolution, the situation simplifies with a chiral salt of a racemic substrate (1 : 1 mixture of contained enantiomers). Then the crystals that deposit initially will have a diastereoisomeric excess of (1 - D)/(1 + D); That is 81.8% de if D = 10%. Indeed it is convenient to measure a value of D from the first crystals formed. If recrystallising salt from an already high diastereoisomeric purity, then the crystals will approach: deC = 1 - D.(1 - deL) where deC and deL are the diastereoisomeric excess of the crystals and liquors respectively. However, in an actual resolution process, as crystals are deposited, the liquors will change composition and consequently further crystals will have a lower diastereoisomeric excess. Making approximations that (i) the value of D stays constant throughout the composition range, and (ii) that the crystal composition equilibrates with the liquors, then the crystal composition can be related to the yield of crystals and the solid-solution extent D according to the quadratic equation below. Here, XA0 is the starting composition (as the mole fraction of component 'A') and R is the yield. This quadratic can be solved in the usual way for the crystal composition XAC. For example, it can be worked out from this equation that with a solid solution extent D = 10%, resolution of racemic substrate by classical resolution to a 50% yield would give only 52% de crystals (mole fraction X = 0.76). It also shows that even a small extent of solid-solution formation can have a significant impact on a resolution process. So with D = 0.1%, at 50% yield the crystals will be 94% de, some way short of being isomerically pure.
Note the assumption here that the crystals remain in equilibrium with the liquors, i.e. initially formed crystals can dissolve and redeposit with a composition in accord with the new liquor composition. If such equilibrium is not attained, for instance if crystallisation is rapid and the experiment is curtailed early, then the crystals should have a more favourable composition in respect of the wanted isomer.
A Pair of Diastereoisomers Forming a Eutectic
As mentioned earlier, the value of D approximates to the ratio of solubilities of solid-solutions
consisting entirely of compound 'A' or entirely of 'B'. So if D = 5%, 'B' will be twenty times as
soluble as 'A'. If 'A' then has a solubility of 100 g/L it is obvious that pure 'B' will not crystallise
at all in this crystal form. Rather, the usual experience is that compound 'B' will crystallise but that
it will do so in some different crystal form. This places a limit on the effectiveness of resolution
process, since (aside from solid-solution formation) once more than a certain amount of 'A' has crystallised,
then if the concentration of the solution is high enough, 'B' will crystallise also. After this point, the
liquors will attain a constant (eutectic) composition. In this regard, the ternary phase diagram of a pair
of diastereoisomers and solvent will generally show two solubility lines, which intersect at the eutectic as shown
by the ternary phase diagram depicted in the figure below. Each diastereoisomeric crystal-form could be
a solid-solution accomodating the other isomer (to a different extent).
The diagram shows the situation where the solid-solution extent (of both isomeric crystal forms) is
10%, or one of a range of values selected by hovering the cursor over the choices on the left.
A green-coloured tie-line has been added to represent a resolution where, starting with the racemate of the
compound to be resolved, a crystal yield of 50% is obtained. At this yield the crystal and liquor diastereoisomeric
excesses are equal (opposite sign only). With a solid-solution extent of only 5%, such a resolution is
governed by the presence of the eutectic composition, i.e. the liquors that remain are of this composition, and
the crystals will be a mixture of crystal forms. On the other hand, with the solid-solution extent at 7.5% or
higher, the position of the eutectic is of no importance and only the single crystal form would deposit at a
crystal yield of 50%.

Also, below is an interactive calculator for the phase diagram solubility lines for two hypothetical solutes A and B that have respective solubilities of 20% and 40% with mutual solid-solution extents input in the range 0 - 1 (for 0 - 100%). Enter new figures in the yellow input cells and the press the 'calculate phase diagram' button to see how the solubility lines move.
Binary Phase Diagrams
The above consideration has been made by reference to ternary phase diagrams that include the solvent as one component. It is noteworthy that the same analysis can be used to construct corresponding binary phase diagrams, for instance that shown below. Here the relationship between liquor composition (liquidus) and crystal composition (solidus) at equilibrium is given simply by a horizontal tie line. Green lines are also added to indicate a 50% yield resolution, in this case governed by the eutectic composition.
Whilst most of the discussion has been about diastereoisomeric salts, it does not have to be so. The Figure below shows a calculated binary (melting point) phase diagram for a chiral conglomerate in which there are solid-solutions between the enantiomers. A chiral conglomerate is one where the enantiomers crystallise together as a physical mixture rather than in a crystal form that contains both enantiomers together. The liquidus is calculated by the Schröder-Van Laar equation but its slope is corrected for the solid-solution. Limits of the miscibility gap between the solid solutions are given by X = 1/(1 + D) and D/(1 + D). The estimation is approximately consistent with experimental phase diagrams [J. Jacques, A. Collet, S. H. Wilen, Enantiomers, Racemates and Resolutions, Krieger, Malabar, 1981, reprinted 1994].
Conclusions
The solid-solution extent coefficient D is useful both in comparing different crystallisation experiments and in predicting how new experiments will perform. In particular a value of D can be gathered simply by measuring the corresponding compositions of crystals and liquors in respect of the content of the two components to be separated. In actuality, the value of D observed is not necessarily due to the formation of a solid-solution but might be due to a different cause, for instance due to crystal defects or due to the deposition of more than one form. Whatever, its value is useful as a measure of the relative distribution of two compounds between two different phases.